Table of Contents
Image
TL;DR: Intel Core i9 13900KS vs i9 13900K for Content Creation
In most of our tests, the new Intel Core i9 13900KS performed identically to the Core i9 13900K. Across the nine applications we tested, six (including all of the photo/video editing applications) showed no significant difference between the 13900KS and 13900K. Of the applications that did have a performance difference, one was in the wrong direction (primarily the build lighting test in Unreal Engine) with the 13900KS performing significantly worse than the 13900K – likely due to a software bug.
Multi-core rendering in Cinebench and V-Ray, however, were the few areas where the 13900KS was significantly faster than the 13900K. Here, we saw a solid 6-7% gain in CineBench and a smaller 3.5% gain in V-Ray. The AMD Ryzen 7950X is still probably the better option for those workloads (assuming you don’t have the budget to go up to AMD Threadripper PRO), but the 13900KS does lessen AMD’s performance lead by quite a bit.
Overall, the Core i9 13900KS is a very niche product, and likely only interesting for those looking for the absolute best-of-the-best Intel Core, and don’t mind paying a premium for minimal performance gains.
Introduction
Back in October of 2022, Intel launched the first of their Core 13th Gen processors, including the Core i5 13600K, Core i7 13700K, and Core i9 13900K. These CPUs are terrific for a wide range of workflows, in many cases making them the clear leader over their primary competition from AMD. Today, Intel is looking to further extend its lead with the launch of an even higher-end model: the Intel Core i9 13900KS.
The i9 13900KS is a special, limited edition processor that is geared toward users that want the absolute best performance possible. In terms of base specs, however, it is very similar to the normal Core i9 13900K model, with only a slight .2 GHz increase frequency via both the base and “Intel Thermal Velocity Boost”, as well as a small increase in the base power draw. Interestingly, the maximum turbo power draw is the same between the Core i9 13900K and the new i9 13900KS, which means that while the 13900KS should be a bit faster for lightly threaded workloads, it may be virtually identical for more highly threaded tasks. Going from 5.8 GHz to 6 GHz is only a 3.5% increase in frequency, however, so the real-world difference between the 13900KS and 13900K is likely to be fairly small.
If you want to see the full specs for the Core i9 13900KS, we recommend checking out the Intel Ark Page for the 13900KS, but at a glance, here are what we consider to be the most important specs:
| CPU Model | Cores (E+P) / Threads | Base Clock | Boost Clock | TDP (Max) | MSRP |
|---|---|---|---|---|---|
| AMD Ryzen 9 7900X | 12 / 24 | 4.7 GHz | Up to 5.6 GHz | 170W | $549 |
| Intel Core i9 13900K | 24 (8+16) / 32 | 3.0 GHz | Up to 5.8 GHz | 125W (253W) | $589 |
| Intel Core i9 13900KS | 24 (8+16) / 32 | 3.2 GHz | Up to 6.0 GHz | 150W (253W) | $689 |
| AMD Ryzen 9 7950X | 16 / 32 | 4.5 GHz | Up to 5.7 GHz | 170W | $699 |
| Intel Core i9 12900KS | 16 (8+8) / 24 | 3.4 GHz | Up to 5.5 GHz | 150W (241W) | $739 |
On the whole, the 13900KS should be a fairly minor upgrade to the 13900K, with a small performance boost in exchange for the $100 higher MSRP. Interestingly, Intel priced the 13900KS to be much more attractive than the previous generation 12900KS, possibly to keep it just shy of the Ryzen 9 7950X’s MSRP.
We have tested this type of “KS” variant in the past, and we found that the previous 12900KS was only about 3% faster than the 12900K on average for content creation. With the 13900KS having a much smaller price premium over the base 13900K, we are very interested to see if it maintains this ~3% gain, or if it is a better (or worse) value.
Test Setup
Intel Core Test Platform
| CPU: Intel Core i9 13900KS 8+16 Core Intel Core i9 13900K 8+16 Core |
| CPU Cooler: Noctua NH-U12A |
| Motherboard: Asus ProArt Z690E-Creator WiFi |
| RAM: 2x DDR5-4800 32GB (64GB total) |
| GPU: NVIDIA GeForce RTX 4080 16GB |
| Storage: Samsung 980 Pro 2TB |
| OS: Windows 11 Pro 64-bit (22621) |
AMD Ryzen Test Platform
| CPU: AMD Ryzen 9 7950X 16 Core AMD Ryzen 9 7900X 12 Core |
| CPU Cooler: Noctua NH-U12A |
| Motherboard: Asus ProArt X670E-Creator WiFi |
| RAM: 2x DDR5-4800 32GB (64GB total) |
| GPU: NVIDIA GeForce RTX 4080 16GB |
| Storage: Samsung 980 Pro 2TB |
| OS: Windows 11 Pro 64-bit (22621) |
Benchmark Software
| Adobe Photoshop 24.1.0 PugetBench for Photoshop 0.93.6 |
| Adobe Lightroom Classic 12.1 PugetBench for Lightroom Classic 0.94 |
| After Effects 23.1 PugetBench for After Effects 0.95.6 |
| Premiere Pro 23.1 PugetBench for Premiere Pro 0.95.5 |
| DaVinci Resolve 18.1.2 PugetBench for DaVinci Resolve 0.93.2 |
| Unreal Engine 4.26 PugetBench for Unreal Engine 0.1 Alpha |
| Blender 3.4.0 |
| CineBench R23 |
| V-Ray 5.02.00 |
To see how the Intel Core i9 13900KS performs, we will be comparing it to the normal i9 13900K, as well as the AMD Ryzen 9 7900X and 7950X. For the tests themselves, we will be primarily using our PugetBench series of benchmarks. Most of these benchmarks include the ability to upload the results to our online database, so if you want to know how your own system compares, you can download and run the benchmark yourself. Our testing is also supplemented with a number of benchmarks directly from the software developers for applications like Cinema4D, Blender, and V-Ray.
The system configurations are a little bit different than what most other reviewers are likely to be using, so we wanted to provide a bit of an explanation. The big thing to understand is exactly who our testing is tailored for. A lot of hardware reviewers are looking to find out what the maximum performance is from a new product, and use things like high-frequency RAM and big AIO liquid cooling setups to achieve that. Our goal is to see what the performance is in a more workstation-class system where reliability is a larger priority than raw performance. Both goals are 100% valid, but that does mean that some of our system setups (and consequently, the testing results) may be different than what you will find in many other reviews.
First, in terms of motherboard BIOS configuration, we make the following changes from the defaults:
- AMD: Core Performance Boost & Precision Boost Overdrive disabled
- Intel: MultiCore Enhancement disabled & Long Duration Package Power Limit set (125W on 13900K, 150W on 13900KS)
Disabling or tweaking these settings allows the CPU to run at the reference specifications defined by Intel and AMD. In many cases, it results in a massive drop in CPU temperature, with only a minimal impact on performance. We have a full writeup on this in a pair of articles:
- AMD Ryzen 7950X: Impact of Precision Boost Overdrive (PBO) on Thermals and Content Creation Performance
- Intel Core i9 13900K: Impact of MultiCore Enhancement (MCE) and Long Power Duration Limits on Thermals and Content Creation Performance
Even with these settings changed, the Intel Core i9 13900KS is pushing the limits of air coolers like the Noctua NH-U12A. We stayed below the thermal throttle limit even in the heaviest test this time around, but much more than the current 150W P2 power limit of the 13900KS is likely going to start resulting in increasing performance drops.
Second, we are using DDR5-4800MHz memory for both test platforms. The 13th Gen processors technically support up to DDR5-5600MHz if you have one, single rank stick per channel, or DDR5-5200MHz otherwise. Similarly, Ryzen 7000 supports DDR5-5200MHz if using one stick per channel, but without overclocking is technically limited to just DDR5-3600MHz if using 2 sticks per channel.
This mess of what RAM speeds are officially supported based on how many sticks you are using, and whether they are single or dual rank, makes it extremely hard to standardize on a single configuration. Luckily, most of the applications we test are not significantly affected by RAM speed as long as you don’t take it too far, so we have settled on using DDR5-4800MHz across the board. This is also the fastest speed of DDR5 we can currently get that is fully JDEC compliant, which for us as a workstation manufacturer, is a critical factor.
Lastly, we currently test with VBS (Virtualization-based Security) and Windows Defender disabled. Disabling Defender isn’t something we recommend doing for normal usage, but it can cause run-to-run variations during benchmarking, so we leave it off to help with consistency.


Photography: Adobe Photoshop
Image
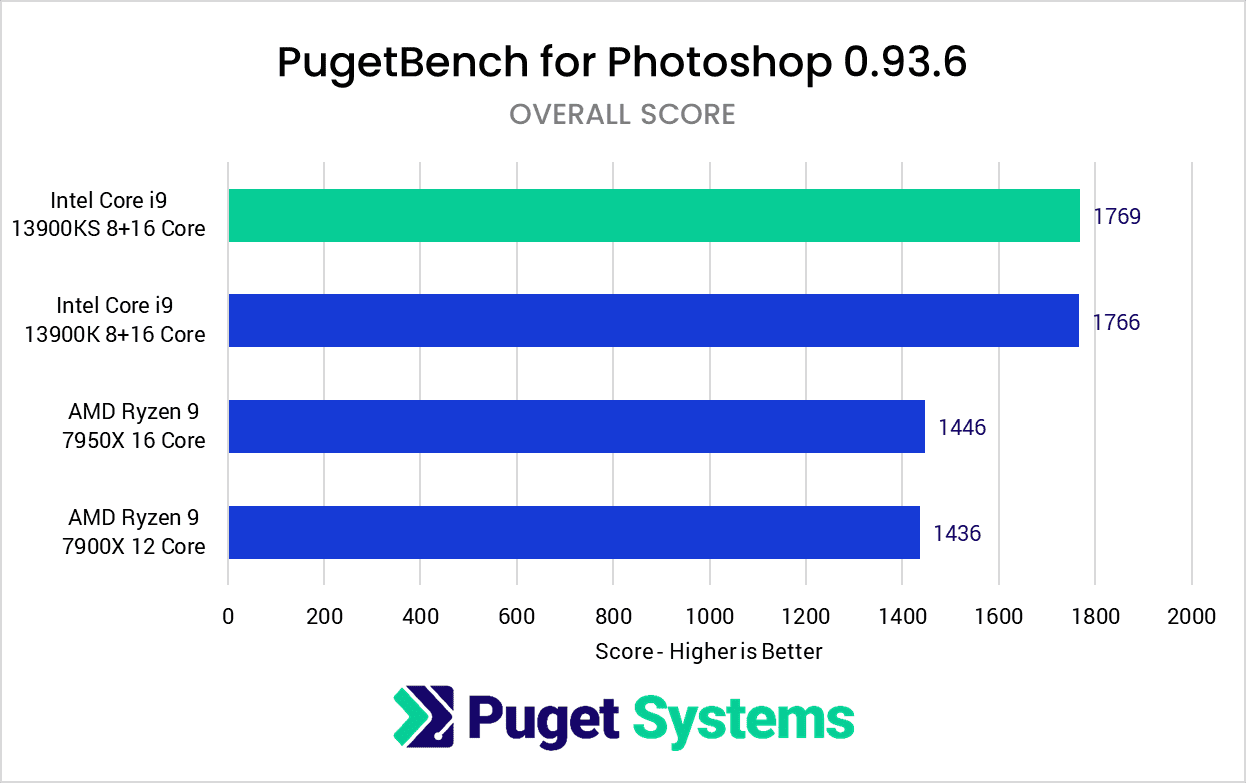
Since Photoshop is a fairly lightly threaded application, this should (in theory) be one of the places where we would see a performance benefit from the i9 13900KS. Unfortunately, the 13900KS and 13900K scored almost exactly the same and well within the margin of error for this kind of testing. Both CPUs are a solid 20% faster than the AMD Ryzen 7900X and 7950X, but if Photoshop is a big part of your workflow, you might as well save some money and stick with the Core i9 13900K.
We even went through the results on a test-by-test basis, but there was nothing noteworthy to pull out and show beyond the Overall Score. When it comes to Adobe Photoshop, we found no benefit to using the 13900KS over the 13900K.
Photography: Adobe Lightroom Classic
Image
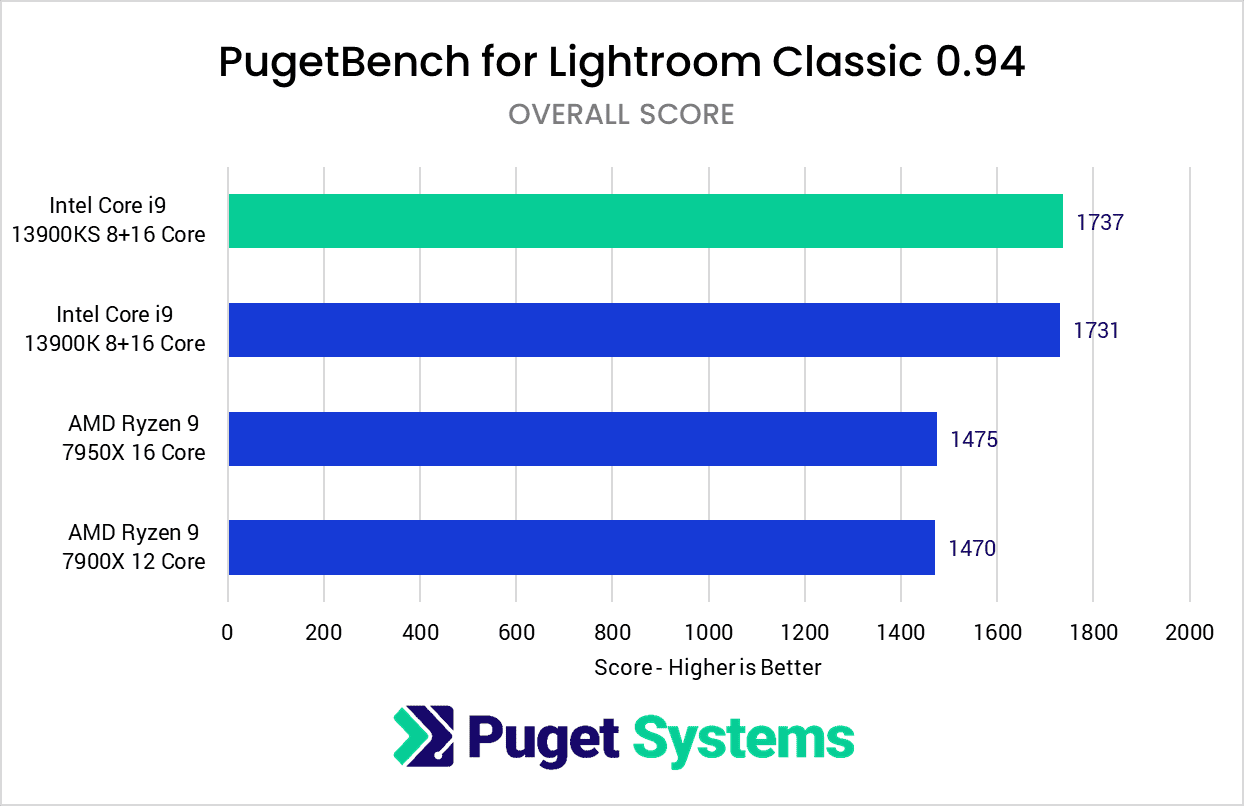
For Adobe Lightroom Classic, we often like to look at different aspects of Lightroom, including passive tasks (importing, exporting, generating previews, etc.), and active tasks (scrolling through images, switching modules, etc.). However, just like with Photoshop, there is not much to discuss as we didn’t see anything different from the individual tests versus the Overall Score.
Simply put, although the 13900KS is much faster than AMD Ryzen for Lightroom Classic, it showed no meaningful performance increase over the i9 13900K.
Video Editing: Adobe Premiere Pro
Image
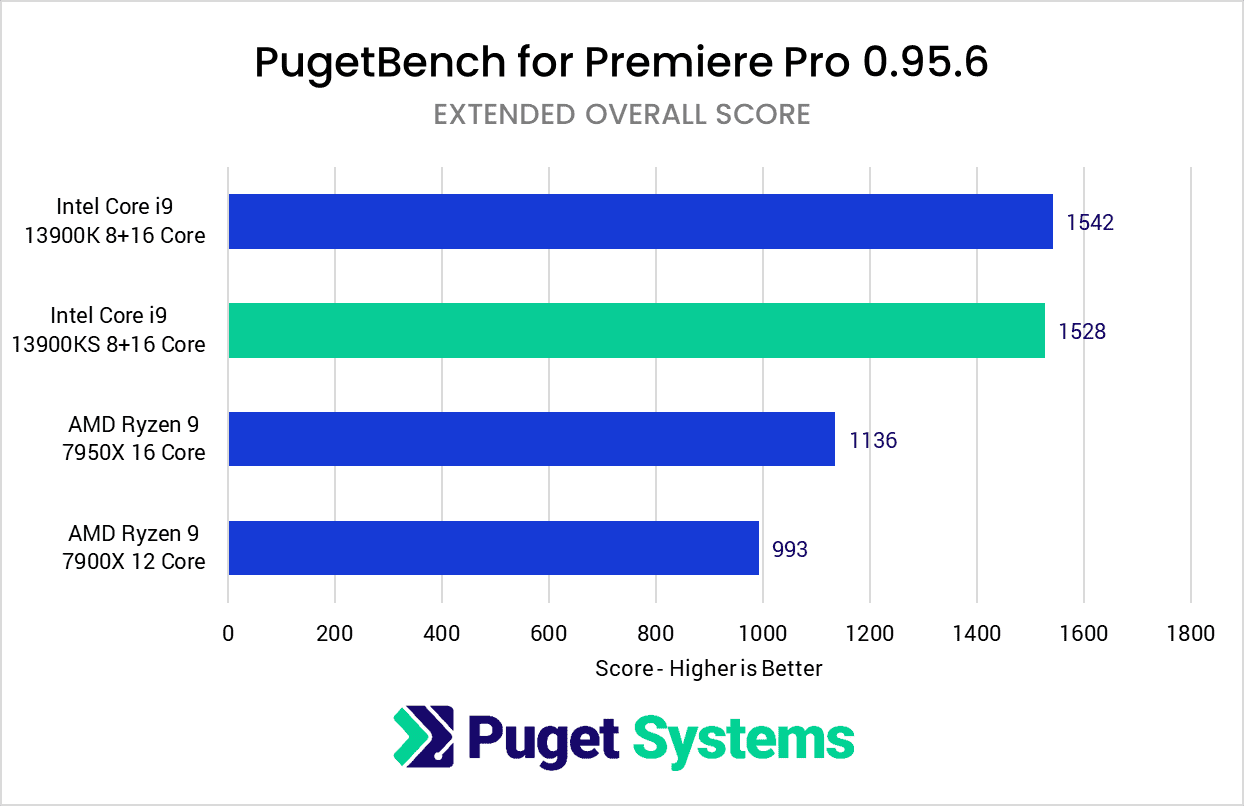
Premiere Pro is often able to utilize more CPU cores than Photoshop or Lightroom Classic, but once again, the 13900KS doesn’t provide any meaningful performance gains. The Intel Core 13th Gen processors are absolutely terrific for Premiere Pro (in large part due to Quick Sync), but the i9 13900KS offered no tangible benefits over the i9 13900K. We are looking at less than a 1% difference in Overall Score, which is never going to be something you will be able to notice, and well beyond the typical margin of error.
Motion Graphics/VFX: Adobe After Effects
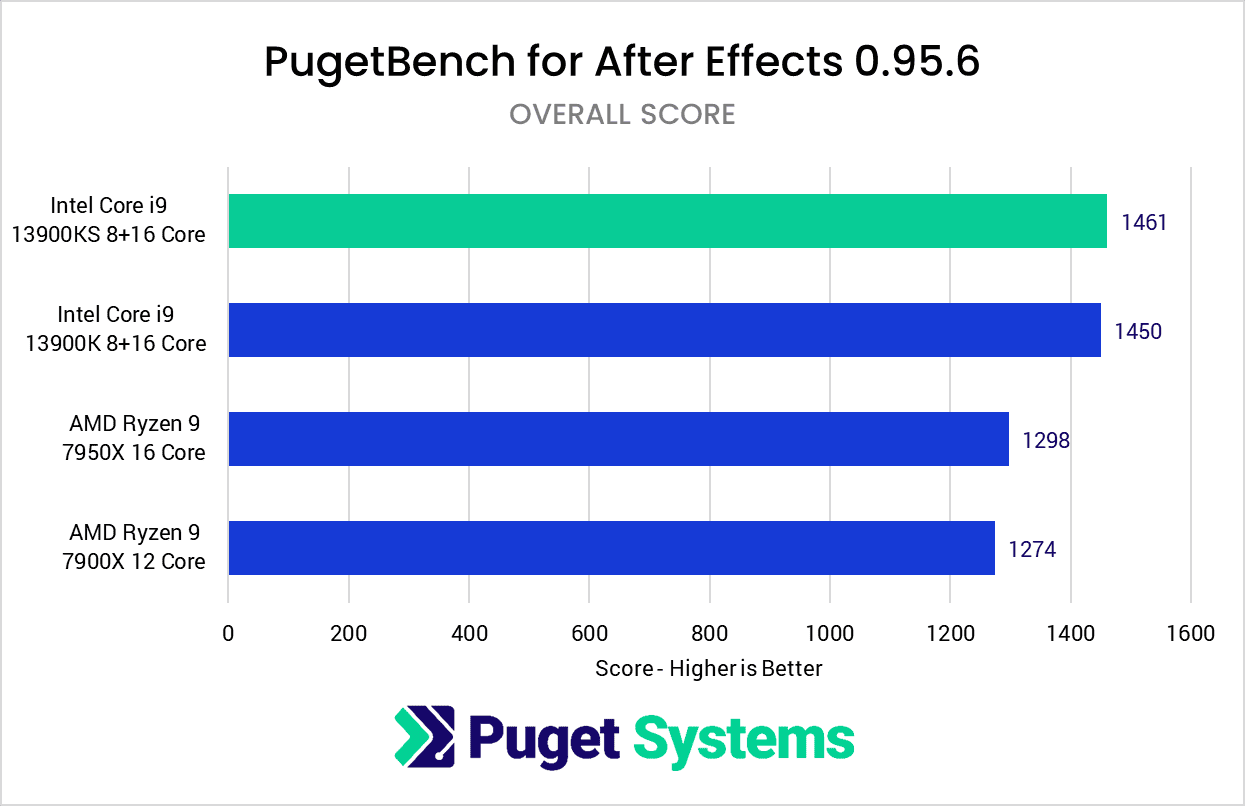
Image
Things are starting to get a bit repetitive at this point, but we do promise that there are some benchmarks coming up that show a difference between the i9 13900K and the new i9 13900KS! Unfortunately, After Effects is not one of those, and again shows no significant difference with the i9 13900KS.
Video Editing: DaVinci Resolve Studio
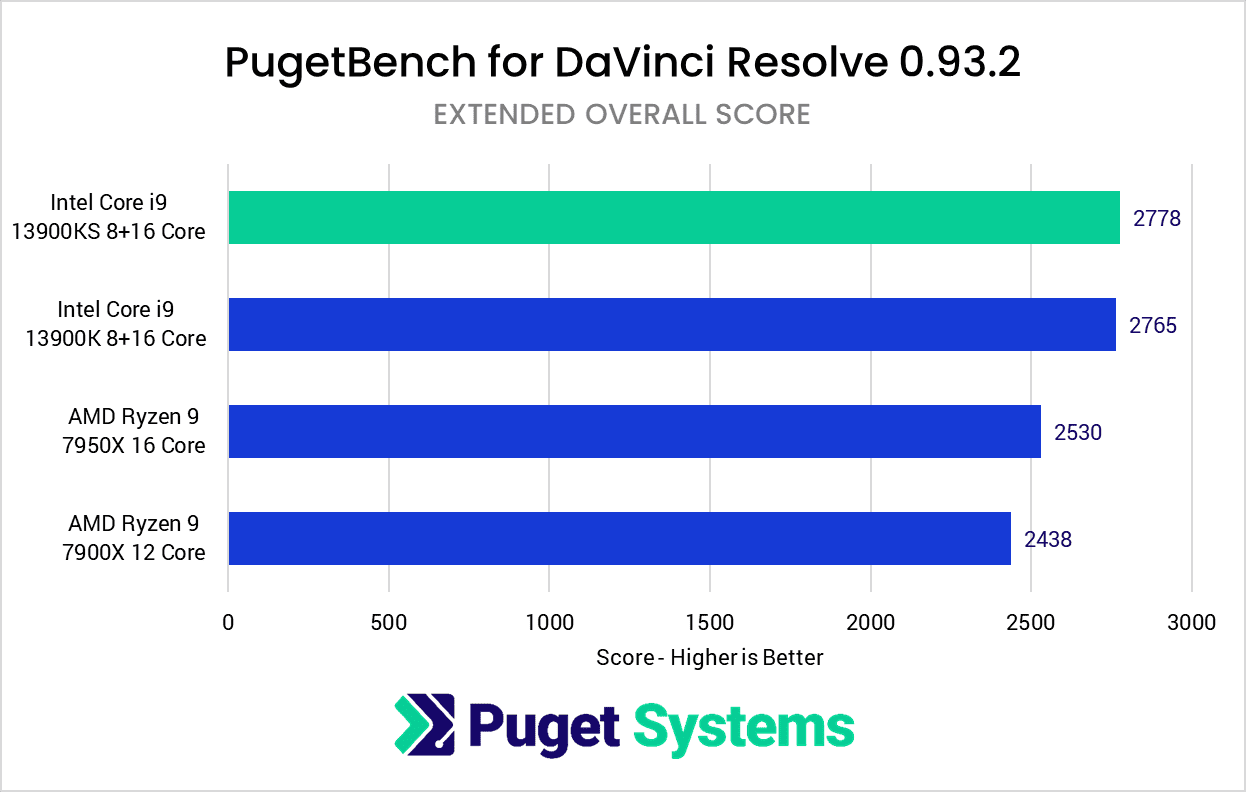
Image
Like everything else we have looked at so far, DaVinci Resolve Studio also shows no benefit to using the Core i9 13900KS over the Core i9 13900K.
Game Dev/Virtual Production: Unreal Engine
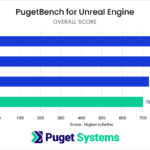
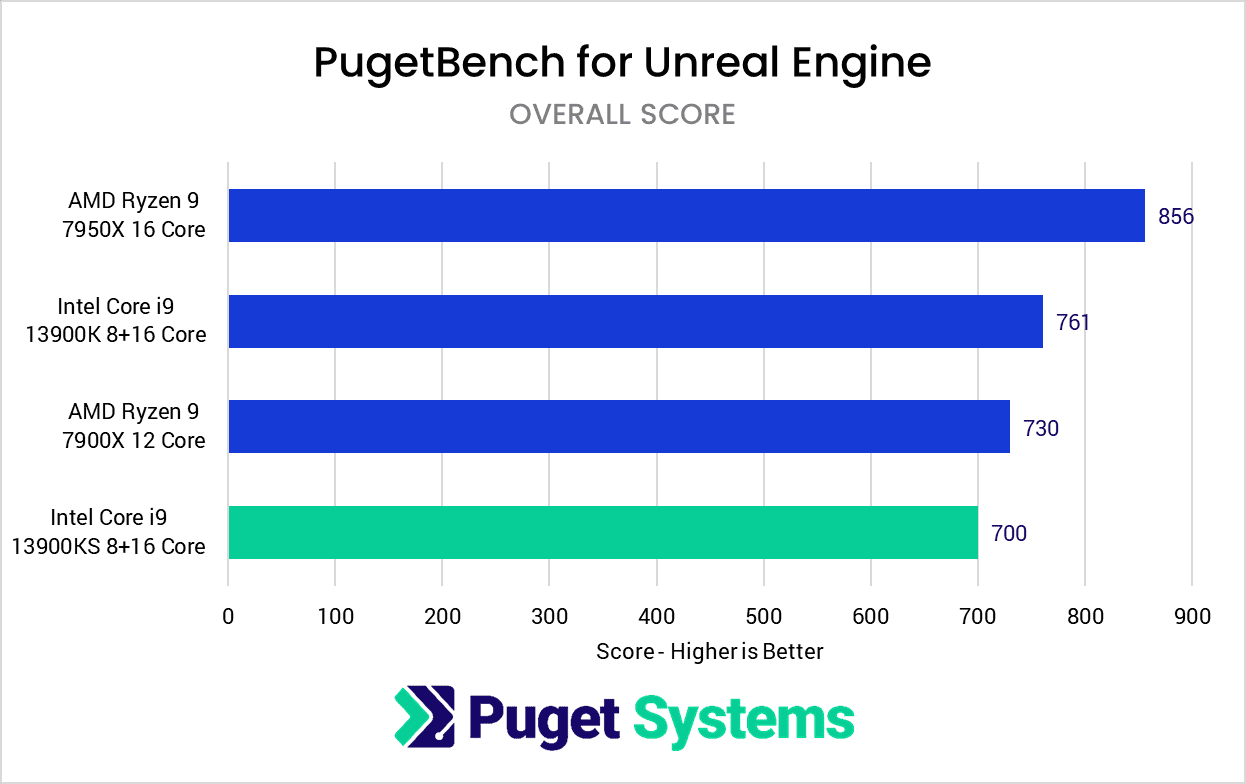
With Unreal Engine, we finally have some results that are worth taking a closer look at. Unfortunately for Intel, however, this is the one set of tests where we found some significant issues with the i9 13900KS.
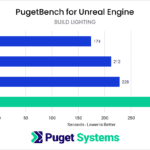
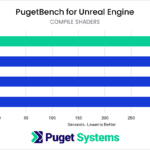
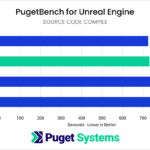
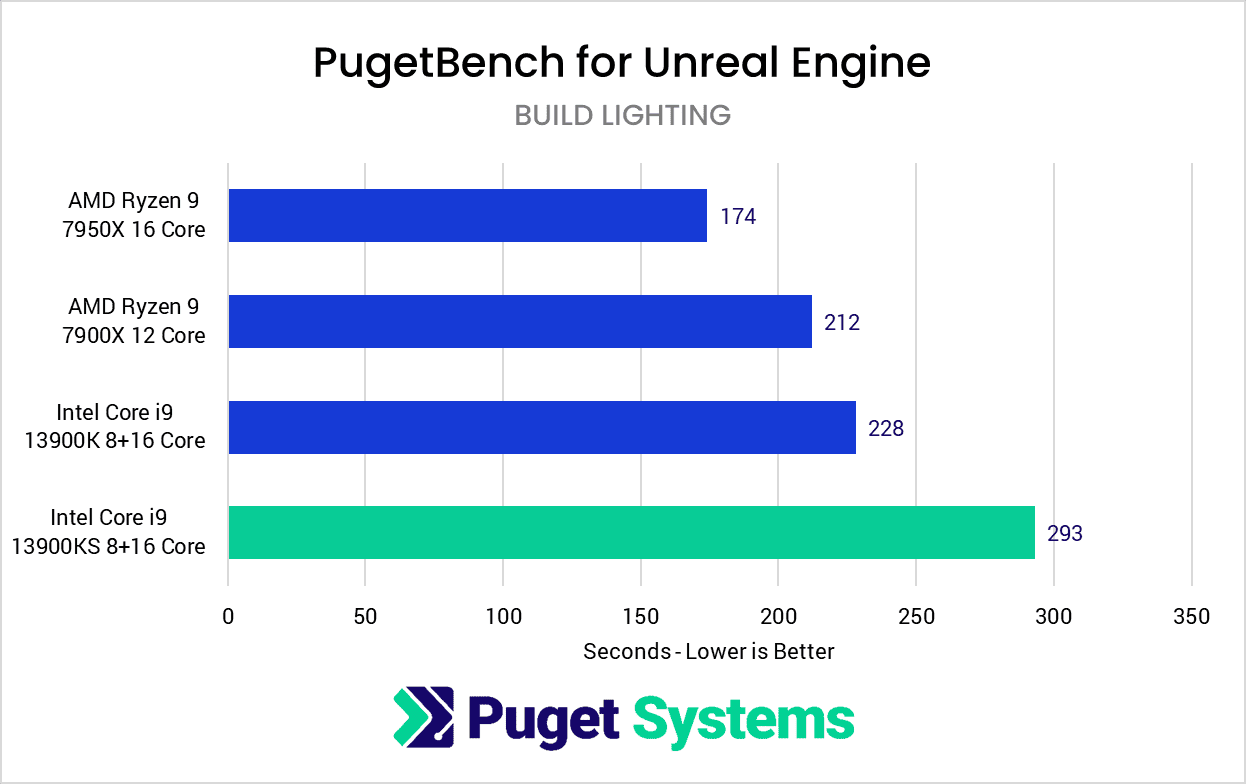
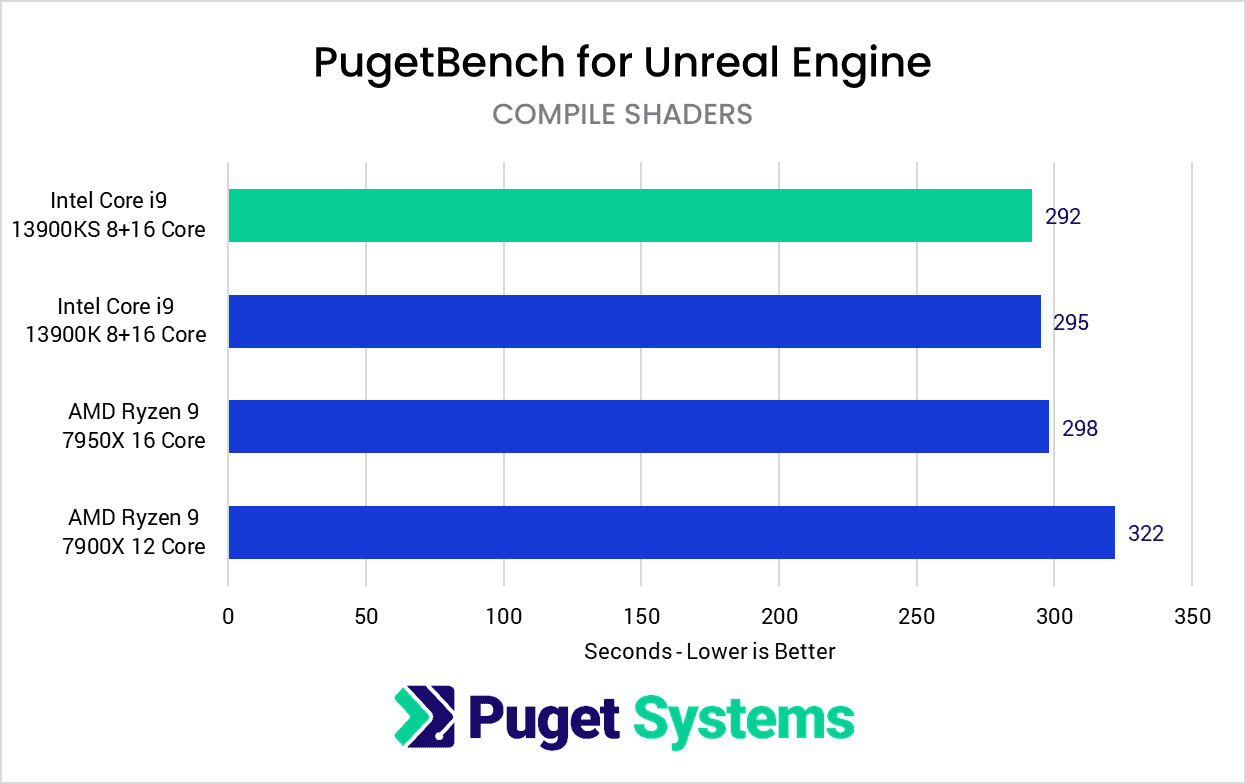
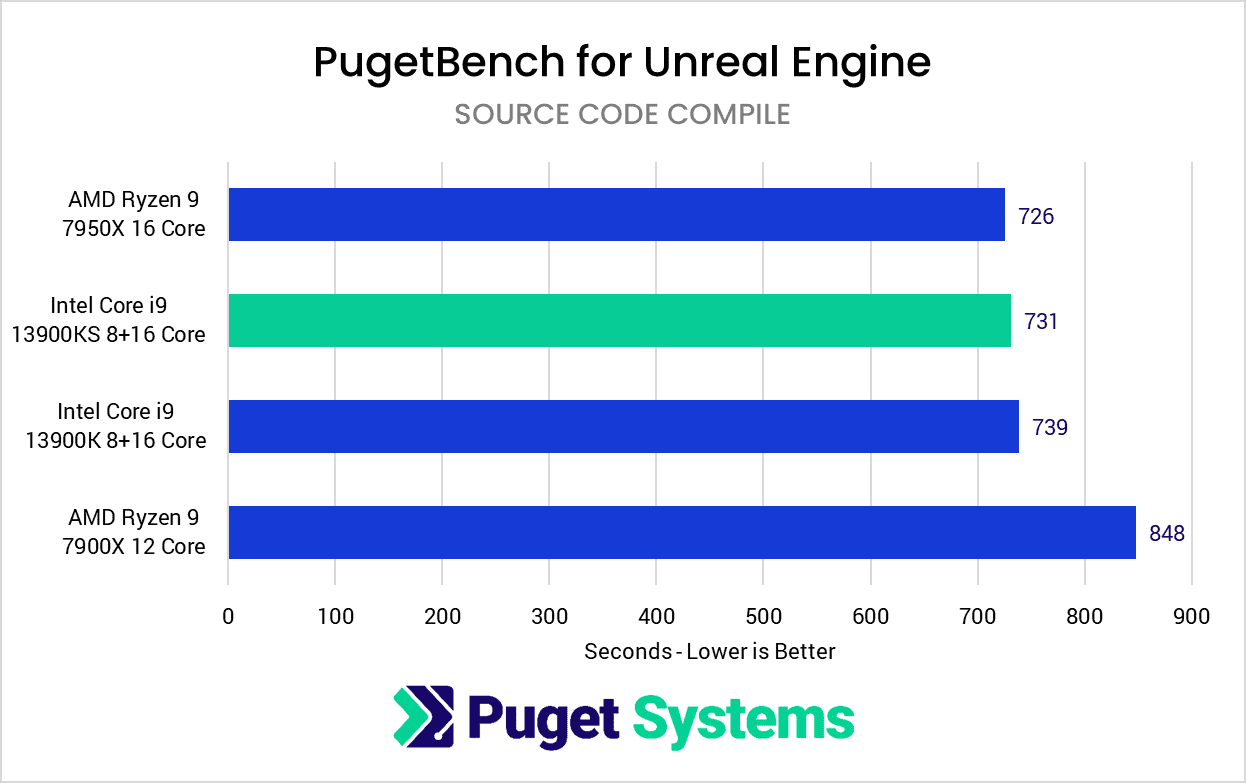
In terms of overall performance in Unreal Engine, the Core i9 13900KS scored about 8% below the i9 13900K. This is entirely due to a massive performance drop with the “Build Lighting” test (chart #2), in which the 13900KS took almost 30% longer to complete than the 13900K. Performance for the other tests (compile shaders and source code compile on charts #3 & 4) are virtually the same between the 13900KS and 13900K, which leads us to believe that this is a simple bug in Unreal Engine, and not a real performance issue with the 13900KS.
We ran the build lighting test multiple times to verify the result, but for now, we would recommend avoiding the Core i9 13900KS if you are a game developer until this issue is resolved. This is not the first time we’ve seen artificially low times on this test. Our Windows 10 Vs Windows 11, Ryzen 5800X3D, and Ryzen 7000 series articles all had issues that were eventually fixed. Unreal Engine just tends to have more issues with recently released hardware than most of the other applications we test.
CPU Rendering: CineBench R23
System Image
Moving on to the first of our CPU-based rendering tests, it is worth pointing out that AMD’s Threadripper PRO line (which isn’t included in this post) has long been the best choice if top performance is required. But, many users are looking for lower-cost systems to send the renders to a dedicated render server or to use GPU rendering, they still want to be sure their workstation is able to handle at least some rendering in a timely manner.
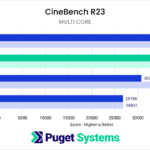
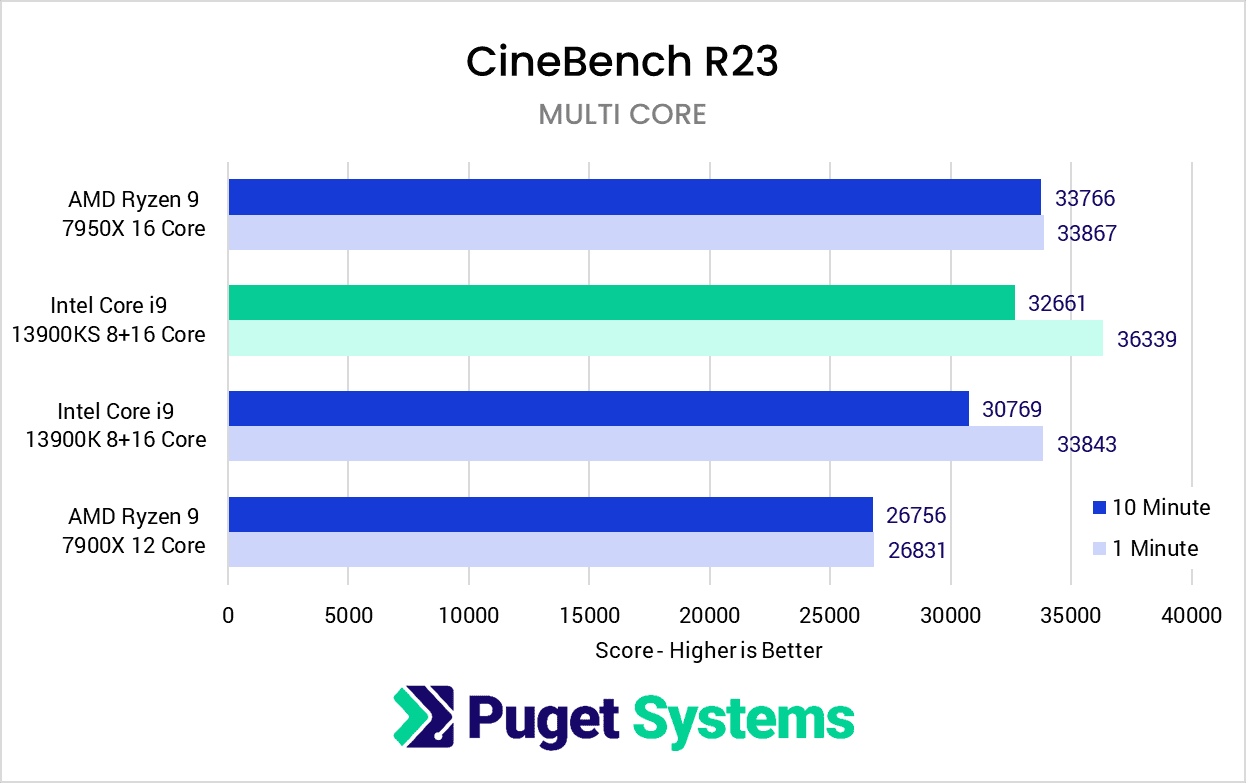
Starting with CineBench R23 in multi-core mode, the Core i9 13900KS was able to show some nice performance gains over the i9 13900K. For short renders that take roughly a minute, the 13900KS scores about 7% higher than the 13900K. Intel 13th Gen CPUs tend to have some performance loss for longer renders, however, which is why we also do a test set to run for 10 minutes to see how the performance changes for longer renders. Here, the 13900KS was again faster than the 13900K, this time by about 6%. This means that the Core i9 13900KS is technically faster than the AMD Ryzen 9 7950X in terms of short-term performance, but it falls a few percent behind the 7950X when doing longer renders.
It is worth pointing out that these multi-core results are quite a bit lower than what you will find in most other reviews. We explained this fully in the Test Setup section, but this is a result of our policy of disabling auto-overclocking in the BIOS (with features like MCE on Intel, and CPB/PBO on AMD) and enforcing the P2 power limits on Intel CPUs. For most workloads, this results in a massive drop in power draw and temperatures, with only a minor decrease in performance. CineBench is one of the few benchmarks where performance is significantly affected and results in about a 15-20% performance drop for 13th Gen, and roughly a 10% drop for AMD Ryzen 7000. It is rare that many of our customers are doing heavy CPU rendering on this class of processor, which for us, makes it a very worthwhile tradeoff. You can read more about this in our AMD Ryzen 7950X and Intel Core i9 13900K power/performance articles.
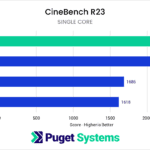
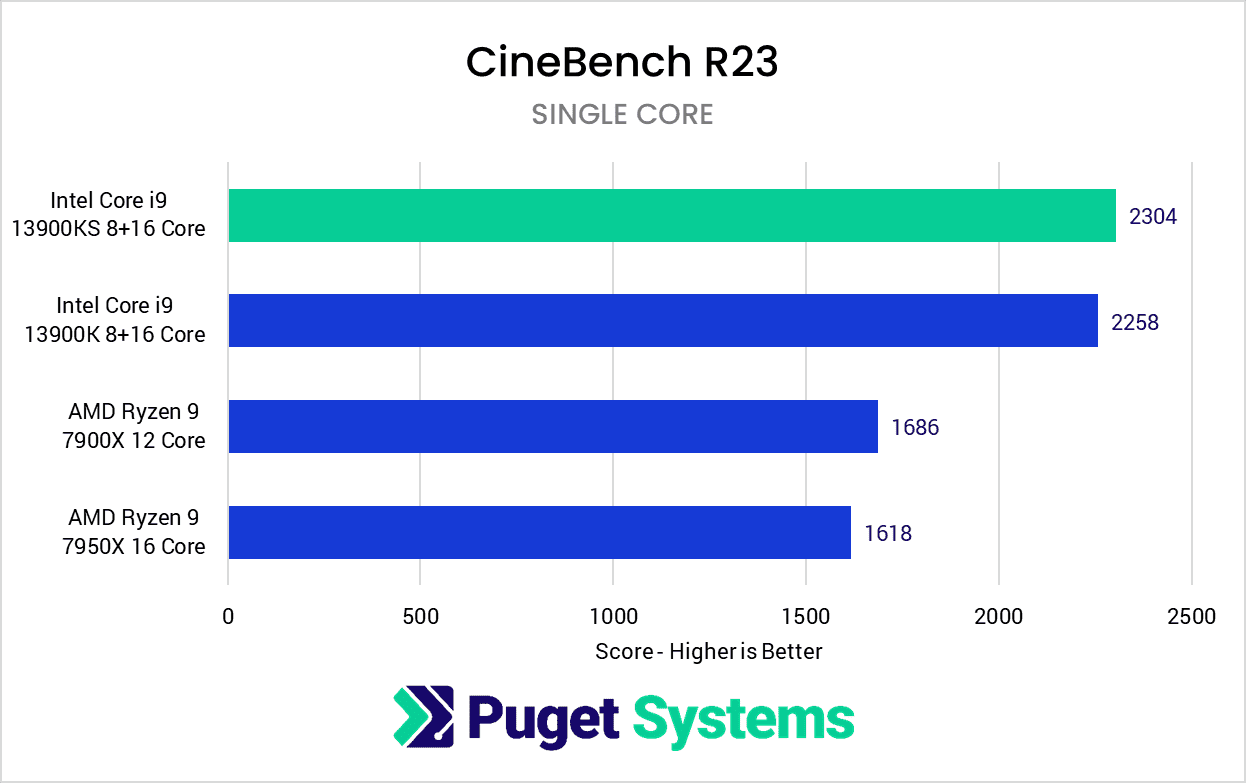
CineBench also allows us to test in single-core mode, which while meaningless for anyone actually interested in rendering performance, is a decent metric of base single-core performance for tasks like modeling in Cinema 4D. Chart #2 shows the result for this test, with the 13900KS only beating the 13900K by about 2%.
CPU Rendering: Blender
Image
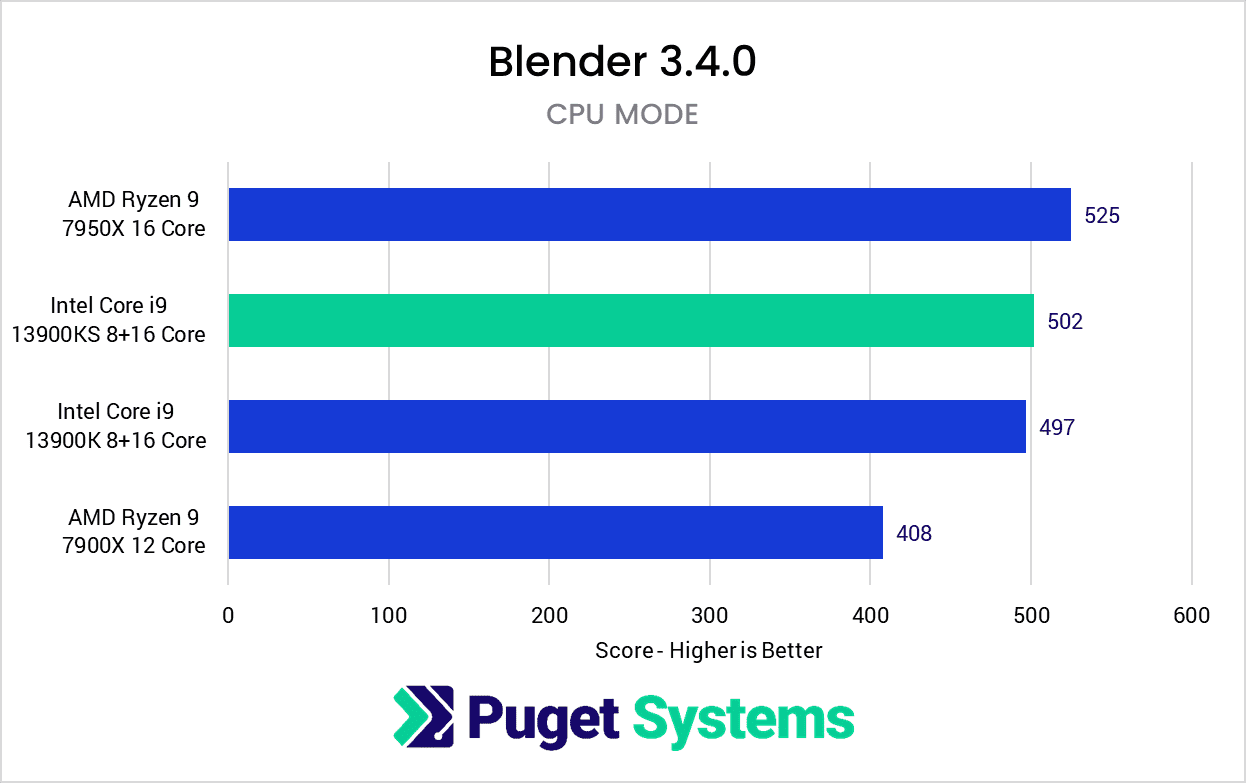
Much like Cinema 4D, Blender is going to use a combination of multi-core and single-core performance depending on the task. For now, the Blender benchmark only covers rendering performance, but we can look to Cinema 4D’s results for modeling.
For CPU rendering performance in Blender, however, the 13900KS only showed about a 1% performance gain over the 13900K. This is nowhere near enough for Intel to catch up to the AMD Ryzen 7950X, so if CPU rendering performance is something you are concerned about, AMD is definitely the way to go at this exact price point.
CPU Rendering: V-Ray
Image
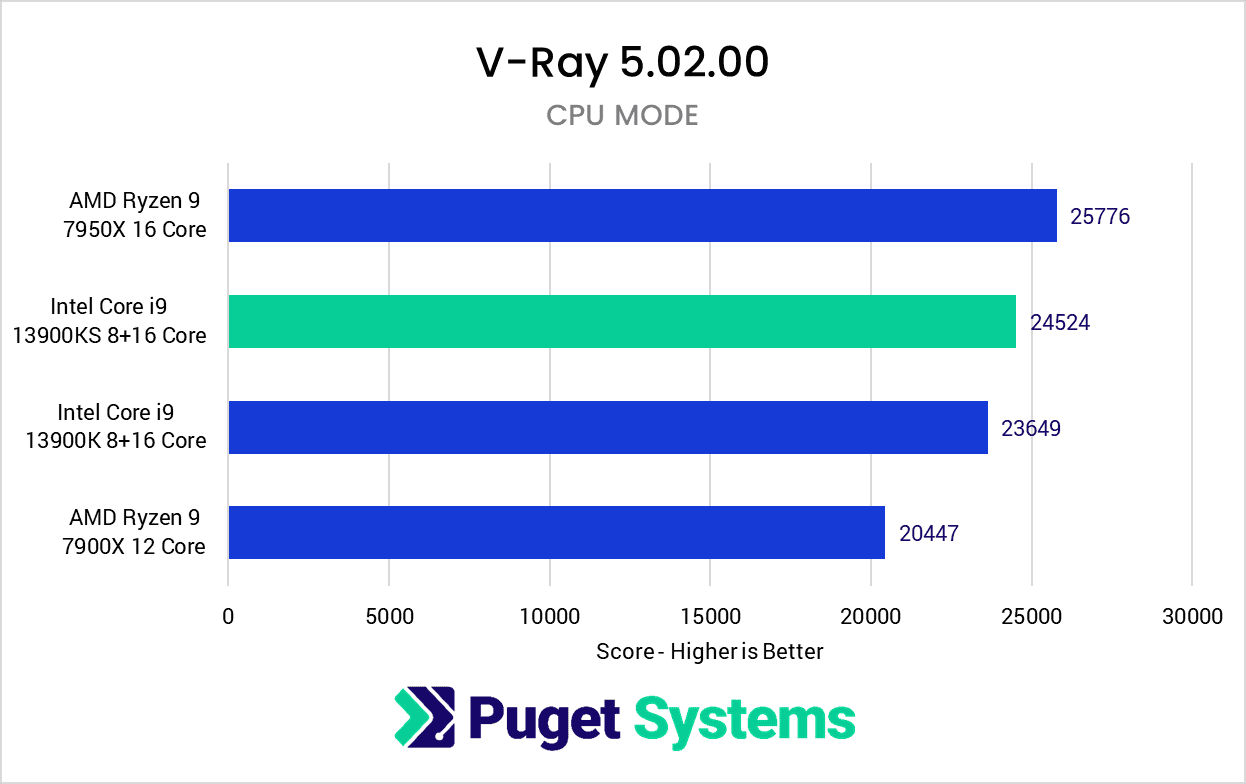
The last up for our testing is CPU rendering with V-Ray. Here, we saw about a 3.5% performance gain with the Core i9 13900KS over the Core i9 13900K. This again isn’t enough for Intel to catch up to the AMD Ryzen 7950X, but at least is fairly in line with the small increase in maximum Turbo Boost frequency.
Is the Intel Core i9 13900KS Worth it for Content Creation?
For most users, the new Intel Core i9 13900KS is not going to be worth its higher cost over the base Core i9 13900K. Across the nine applications we tested, six (including all of the photo/video editing applications) showed no significant difference between the 13900K and 13900KS. Of the applications that did have a performance difference, one was in the wrong direction (primarily the build lighting test in Unreal Engine) with the 13900KS performing significantly worse than the 13900K. This is likely due to a software bug, but still isn’t a great result for a premium product like the 13900KS.
The areas where we did see a concrete increase in performance with the Core i9 13900KS was multi-core rendering in Cinebench and V-Ray. Here, we saw a solid 6-7% gain in CineBench and a smaller 3.5% gain in V-Ray. The AMD Ryzen 7950X is still probably the better buy for those workloads (assuming you don’t have the budget to go up to AMD Threadripper PRO), but the 13900KS does lessen AMD’s performance lead by quite a bit.
Overall, the Core i9 13900KS is a very niche product, and likely only interesting for those looking for the absolute best-of-the-best Intel Core, and don’t mind paying a premium for minimal performance gains. It is also likely better binned for things like overclocking if that is of interest to you, but for workstation purposes, we generally recommend avoiding overclocking as the gains are typically not worth the stability tradeoff. On the whole, most will want to simply stick with the Core i9 13900K and pocket the cost savings.
While the results of our testing mean it is unlikely that we will offer the 13900KS as a regular option in our product line, if you are looking for a workstation for any of the applications we tested, you can visit our solutions page to view our recommended workstations for various software packages, our custom configuration page, or contact one of our technology consultants for help configuring a workstation that meets the specific needs of your unique workflow.
Looking for a content creation workstation?
We build computers tailor-made for your workflow.
Don’t know where to start?
We can help!
Get in touch with one of our technical consultants today.